
Date: 8/9/2022
Author: Chris Hood
People who text while driving really irritate me.
Here in Canada, there are laws against it. Get caught, and you can rack up some hefty fines and demerit points on your license.
But people still do it all the time.
I see those cars bouncing back and forth inside the lane, putting their tires on the shoulder, and more frightening – edging over into my lane.
Even when I try to stay calm, I can’t help cursing under my breath.
“Stay in your lane, a**hole!”
This happened just the other day on my way to the grocery. And after I cooled off a bit, I thought just how relevant the situation was to trading.
Stay between the lines. You’ll probably be a better driver and more profitable trader.
The lines I’m referring to are support and resistance. Two critical components of all chart analysis.
Stop me if you’ve heard this one before: “It’s overbought! The RSI is too high!”
Guess that means it’s time to sell, huh? One problem — a position can stay “overbought” or “oversold” and leave you in the dust..

A support line (or zone) represents where the buyers are. These zones trigger heavy buying on algorithmic trading. They’re also points where lots of retail traders are willing to purchase shares.
In short, support represents demand.
This leads to price bouncing off that zone and rising as the bulls come in to buy.
Likewise, a resistance line (or zone) represents where the sellers hang out. As a ticker hits this level, the sell orders begin flowing in as traders attempt to liquidate their holdings.
It’s easy to buy here because everyone is selling. Some call this a demand zone.
The most straightforward trades occur in the lanes between these spaces.
For bullish trades, go long as the price hits resistance, and your indicators suggest a reversal is imminent. Long calls, bull call spreads, and bull put credit spreads all work if used properly.
On the other hand, shorting via long puts, bear put spreads, and bear call spreads work well as the price hits resistance and the momentum signals begin to weaken.
Look at the following chart of FAS, a 3x leveraged ticker tracking the financial sector.
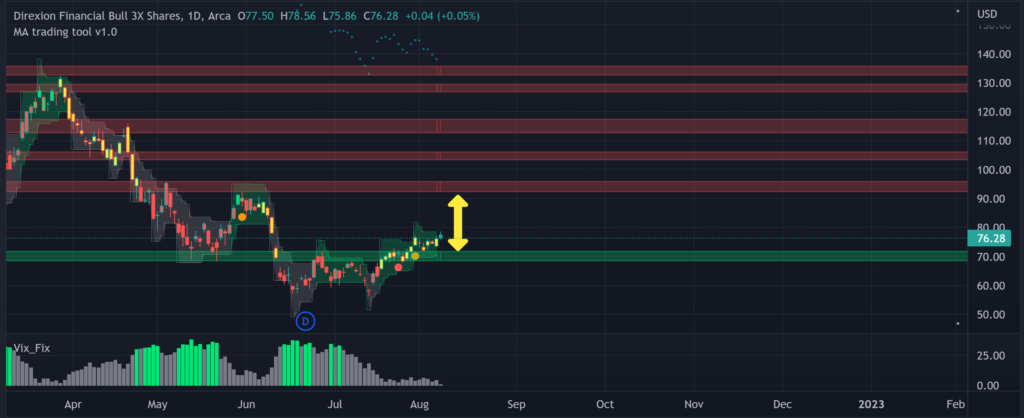
I’ve added a yellow arrow to the white space between 72.14 and 92.46.
Assume you’re trading this chart and the signals you prefer to suggest a bullish move. The easy money would be to trade from the green support to the red resistance level.
It is impossible to know whether or not it will make it there…or when that might happen.
However, just like driving, if you keep it between the lines, you’ll be much safer in the long run.
So always set up your chart with levels of support and resistance. I use a proprietary code to determine mine. However, many traders do exceptionally well with Fibonacci levels, moving averages, and other methods.
Just keep it consistent.
Best of luck with your trades!
Cheers,
Chris Hood