
05/12/2022
Are you waiting on the reversal rally?
Yeah, me too…
Yesterday seemed to be the line in the sand for many traders with the SPY hanging out at the ~$395.00 level and, from my calculations, $394.27 was the make-or-break number to watch.
Let’s just say that Wednesday’s trading session gave us a lot of mixed signals…

(Source: imgur.com)
However, I am seeing some strange block buys, particularly in large caps.
I’m talking order blocks in the billions… And yesterday, there was plenty of size printing in dark pool trading in one of Big Tech’s favorites…
Who’s buying Microsoft (MSFT)?
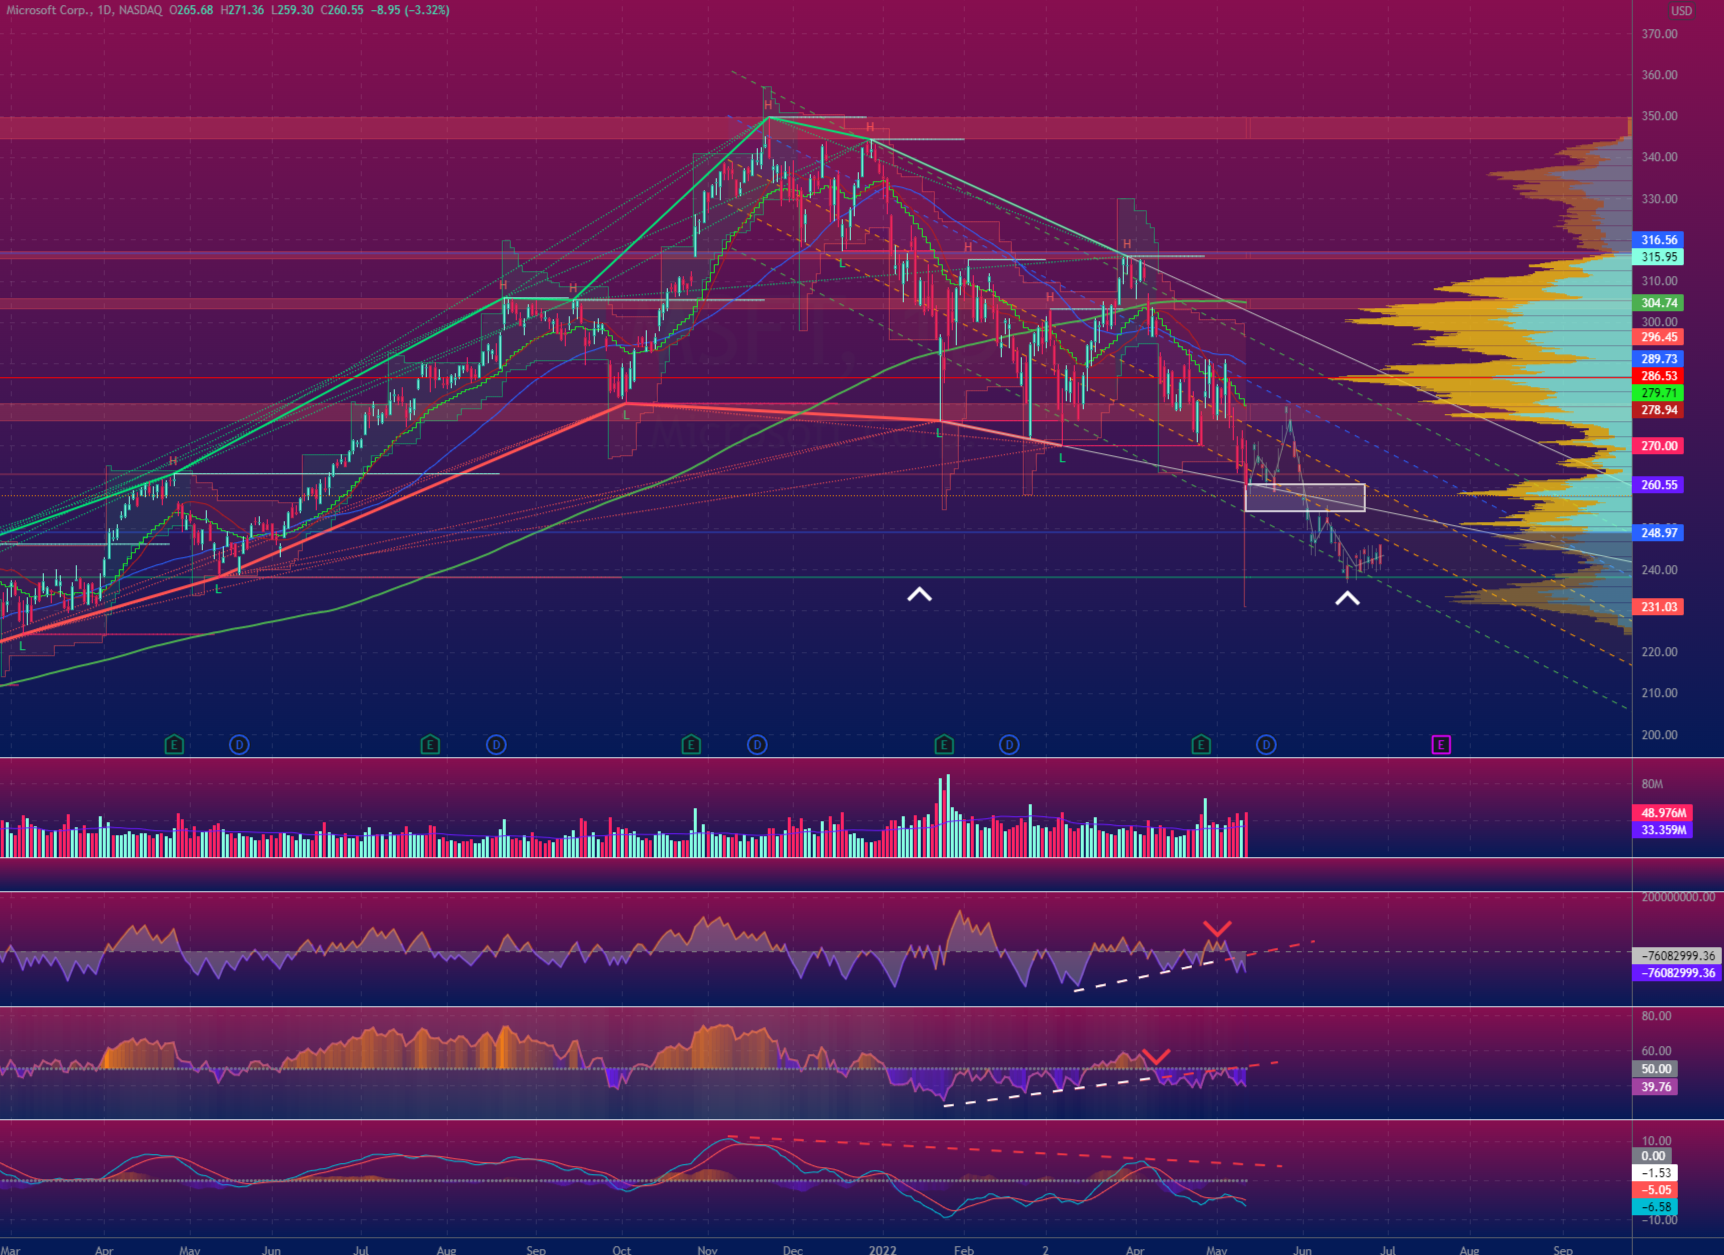
The above chart is a daily lookback to March of 2021, just over one year…
I mentioned the size printed, however, we have to remember that institutions and professional traders can be dead wrong. In fact, a low win rate with a high profit factor is more common than you think.
Clearly, the market hasn’t been too kind to traders and MSFT, but what are the levels to watch now?
I’ve been leaning heavily on the Standard Deviation Channel lately as I’ve included in recent editions of Before the Bell.
That’s the downside multi-colored channel you see with dotted lines referencing one and two standard deviations which are extremely helpful in range trading on all time frames…
In the white box, MSFT is extended to the downside and flirting with the bottom end of the channel and, as you can see, this has typically resulted in a pivot low (“L”) and a short term rally.
Whoever took the bet on the dark pool print did so with a hedge I’m sure, and may have taken the trade based on being near a small support level noted by the thin red horizontal line near the white box (courtesy of Chris Hood’s “Paycheck” method)…
I like the idea… I don’t love it.
A bit of confusion can set in here when looking at the chart.
On the lower indicators (OBV, RSI, MACD) there was a bullish divergence building up until a few days ago when it broke down.
Considering the trendline extended from the Pivot Points, the stock will need to hold above here to see that rally…
Failing this, I’d watch the downside to ~$240.00 support
Keep moving,
(Disclosure: I hold no position in MSFT.)

This material is not an offering, recommendation, or a solicitation of an offer to buy or sell the securities mentioned or discussed, and is to be used for informational purposes only. Any performance results discussed herein represent past performance, not a guarantee of future performance, and are not indicative of any specific investment. Due to the timing of information presented, investment performance may be adjusted after the publication of this report. There can be no assurance that the future performance of any specific investment, investment strategy, or product made reference to directly or indirectly in this communication will be profitable, equal any corresponding indicated historical performance levels or be suitable for your portfolio.


