
11/14/2022
The biggest threat, of course, has been issues with the supply chain…
And if the pandemic taught us anything, you know what this can do to stocks.
Still, what’s important here is how much we rely on chips…

While Big Tech has seen valuations fall at an unbelievable pace, microchips aren’t something we can live without and recent movement in the industry has shown a number of BUY signals.
With the supply chain hiccups supposedly easing up, let’s look at NVIDIA Corp. (NVDA):
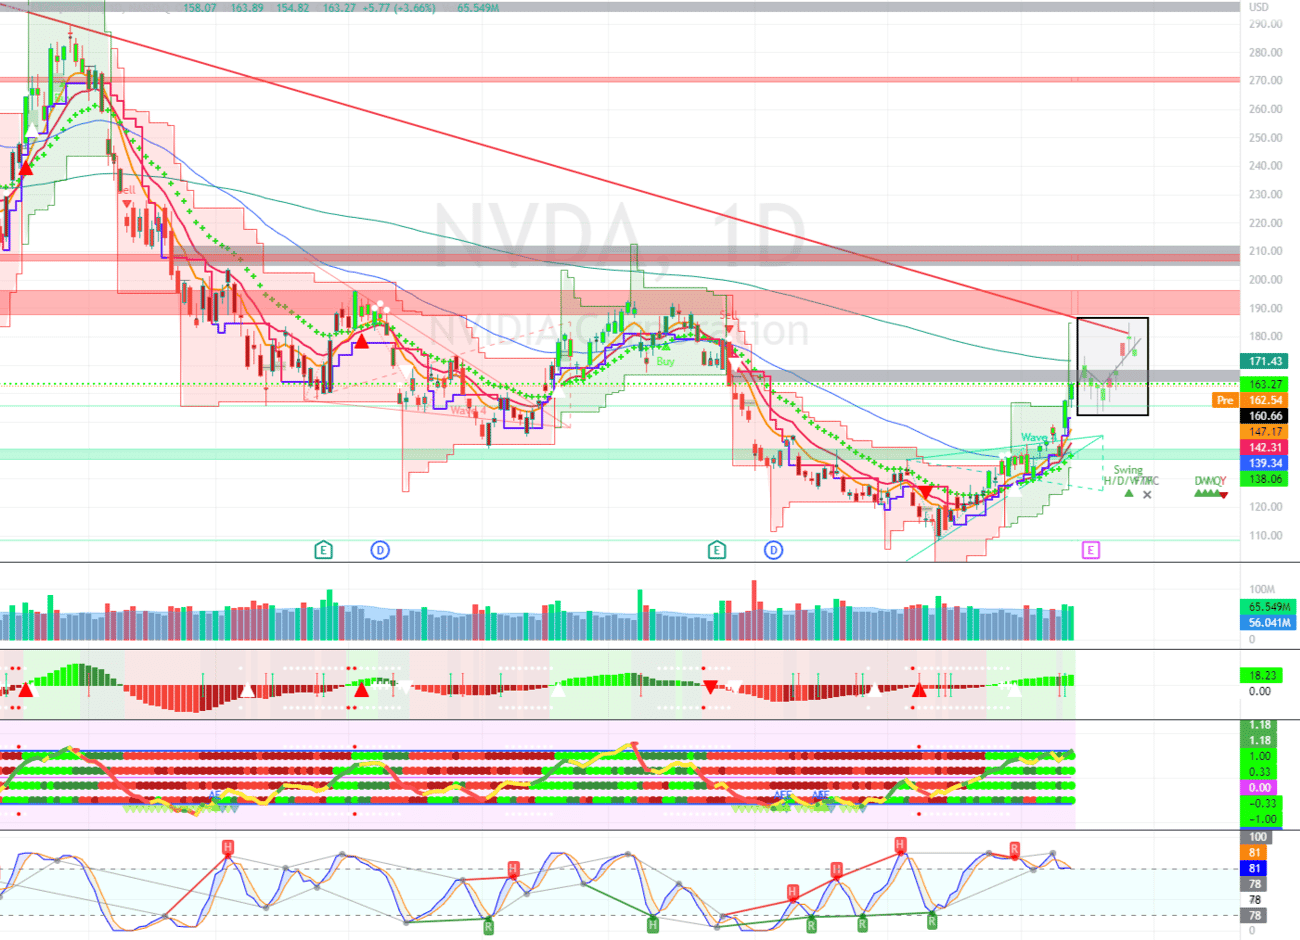
Above is the daily chart since early March of this year…
You can see the trend downward has crushed investors, and the March high wasn’t even the peak.
Is this the bottom? Doubtful.
But it’s good enough to be a bottom…
NVDA currently sits about ~$25.00 away from the next level of resistance.
That’s the red horizontal channel.
The green horizontal channel serves as support and is sitting at ~$140.00.
This was a close call considering, only a week ago, it acted as the single price level holding back any movement.
Now, with the markets lifting higher, the share price is set to break through an untested breaker level from ~$165.00-$168.00 (gray box).
But notice the 200ema in green… I’d expect this to be the first area the share price pulls back from on this move up, barring anything else in the broader market.
After that, the longer term trendline (red) will be the real test — close to the ~$180.00 mark and I’d take the position closer to ~$190.00.
I’ve drawn in the potential pattern in the black box.
Looking to the Alpha Waves tool on the lower chart (second indicator), all we see is bullish.
Depending on how long you’ve been reading along, this is a proprietary tool created by Rogue Investing’s Chris Hood and is used as a primary indicator for the TRADECOMMAND inner circle.
This is all about momentum.
The four green dots and a rising composite Stochastic tell us the squeeze is firing to the upside and has been for several days…
That said, a pullback should be anticipated.
Keeping it simple, watch for ~$158.00 to hold.
If this breaks down, it’s headed back to low ~$140.00’s.
Keep moving,
(Disclosure: I hold no positions in NVDA.)

This material is not an offering, recommendation, or a solicitation of an offer to buy or sell the securities mentioned or discussed, and is to be used for informational purposes only. Any performance results discussed herein represent past performance, not a guarantee of future performance, and are not indicative of any specific investment. Due to the timing of information presented, investment performance may be adjusted after the publication of this report. There can be no assurance that the future performance of any specific investment, investment strategy, or product made reference to directly or indirectly in this communication will be profitable, equal any corresponding indicated historical performance levels or be suitable for your portfolio.


