
11/15/2022
Obviously, sales don’t necessarily increase as overall consumption mellows out.
The issue here is that the jury is still out on exactly what the impact is…
Read this from the Institute of Labor Economics in Germany:
“Even among the few studies that do exist (see Ruhm, 1995, 1996; Ettner, 1997; Ruhm, 2005; Dee, 2001; Ruhm and Black, 2002), most conducted in the U.S., conceptual frameworks and data availability vary widely—especially in terms of identification strategy used, evidence for all types of risky health behaviors is mixed, and overall consensus is lacking.”

But Big Tobacco still pays dividends during recessions and they also acquire smaller companies.
Today’s selection is a smaller company… and beginning to look suspicious.
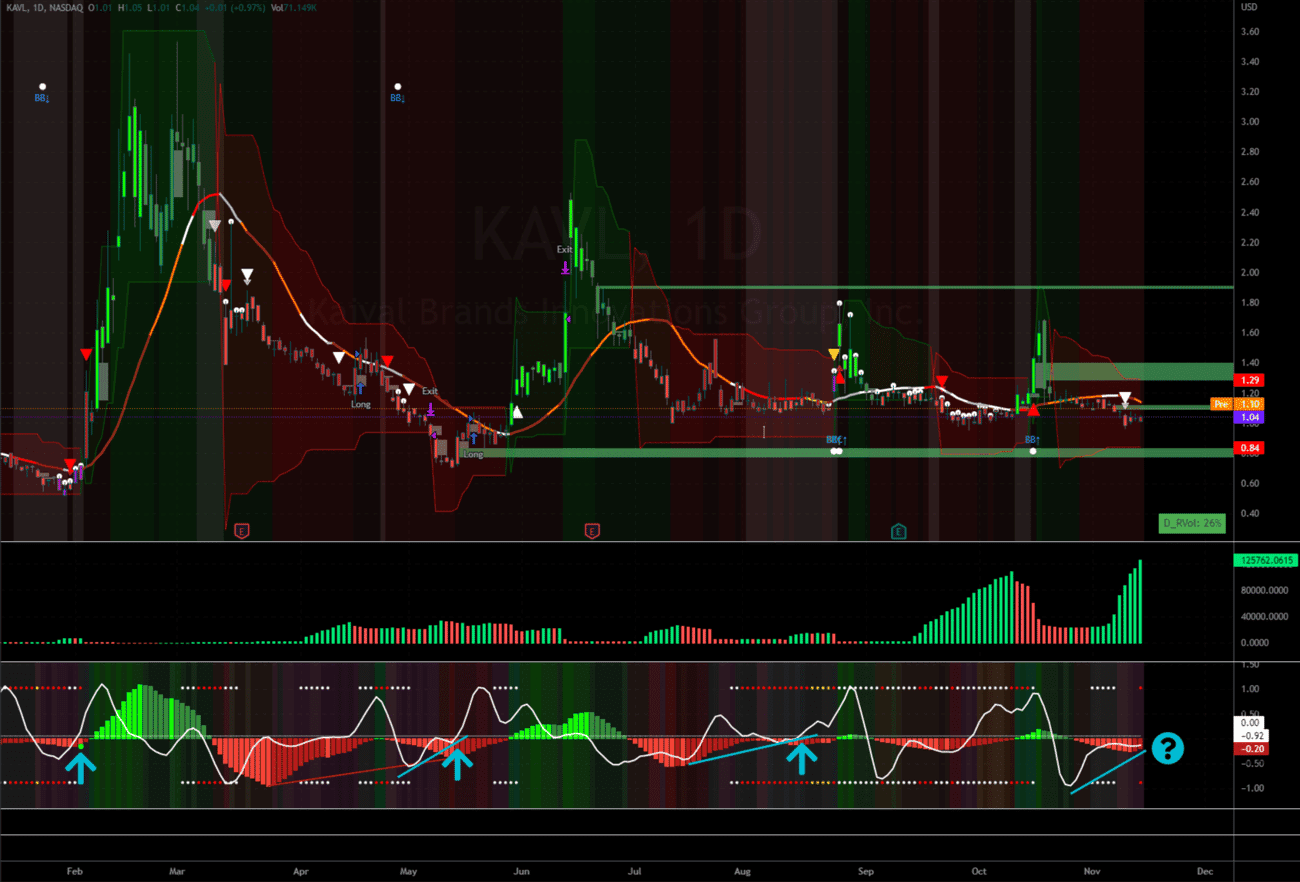
They may not be a tobacco company, but if you’re looking to “rip a fat cloud from a LED-lit goose chamber”, check out Kaival Brands Innovations Group, Inc. (KAVL):
Volatile, yeah? Of course.
I wouldn’t bring it to your attention if it wasn’t…
Remember, volatility is what brings us opportunity.
KAVL is walking a fine line right now on what could be perceived as support.
You’re used to seeing the green horizontal channels highlighting this, although the ones shown in the chart are “Fair Value Gaps”.
In other words, these are breakaway areas that haven’t shown a traditional gap and are uncontested in one direction (up or down) with no overlap…
There’s a rather large one above the current price, however, I’d hesitate to assert that these will always be filled… Typically, it’s the low side that receives attention first…
…like the one at $0.80.
Still, take a look at the lower chart where the Alpha Waves indicator is located.
As mentioned yesterday, this is primarily a momentum tool that’s highly predictive and tends to lead the play…
It’s the same one we use in our live trading through TRADECOMMAND.
This is a variation of it, but my focus here is on the composite Stochastic because there’s a pattern here…
Each time the price bottomed and the Stochastic moved higher above the zero line with a bullish divergence, the stock went parabolic…
(Past performance may not be indicative of future results.)
Is KAVL setting up again?
It could be worth a starter position… But if $0.94 breaks, I’d hop out and wait for the $0.80’s.
I want to see the Stochastic read positive before sizing in.
Keep moving,
(Disclosure: I hold no positions in KAVL, but intend to initiate a position in the next 30 days.)

This material is not an offering, recommendation, or a solicitation of an offer to buy or sell the securities mentioned or discussed, and is to be used for informational purposes only. Any performance results discussed herein represent past performance, not a guarantee of future performance, and are not indicative of any specific investment. Due to the timing of information presented, investment performance may be adjusted after the publication of this report. There can be no assurance that the future performance of any specific investment, investment strategy, or product made reference to directly or indirectly in this communication will be profitable, equal any corresponding indicated historical performance levels or be suitable for your portfolio.


