
9/23/2022
As much as some folks hate when Fed Chair Jerome Powell speaks, I look forward to it.
This isn’t because I’m a fan of his, it’s because I enjoy the volatility…
…although I’m sure a number of traders feel differently right now.

But if you’d used the right tools and anticipated the setup, you could have been in and out with profits.
“Fed Day” and everything that comes with it is all about anticipation… not having an opinion.
You may even already own it. This is Invesco Solar ETF (TAN):
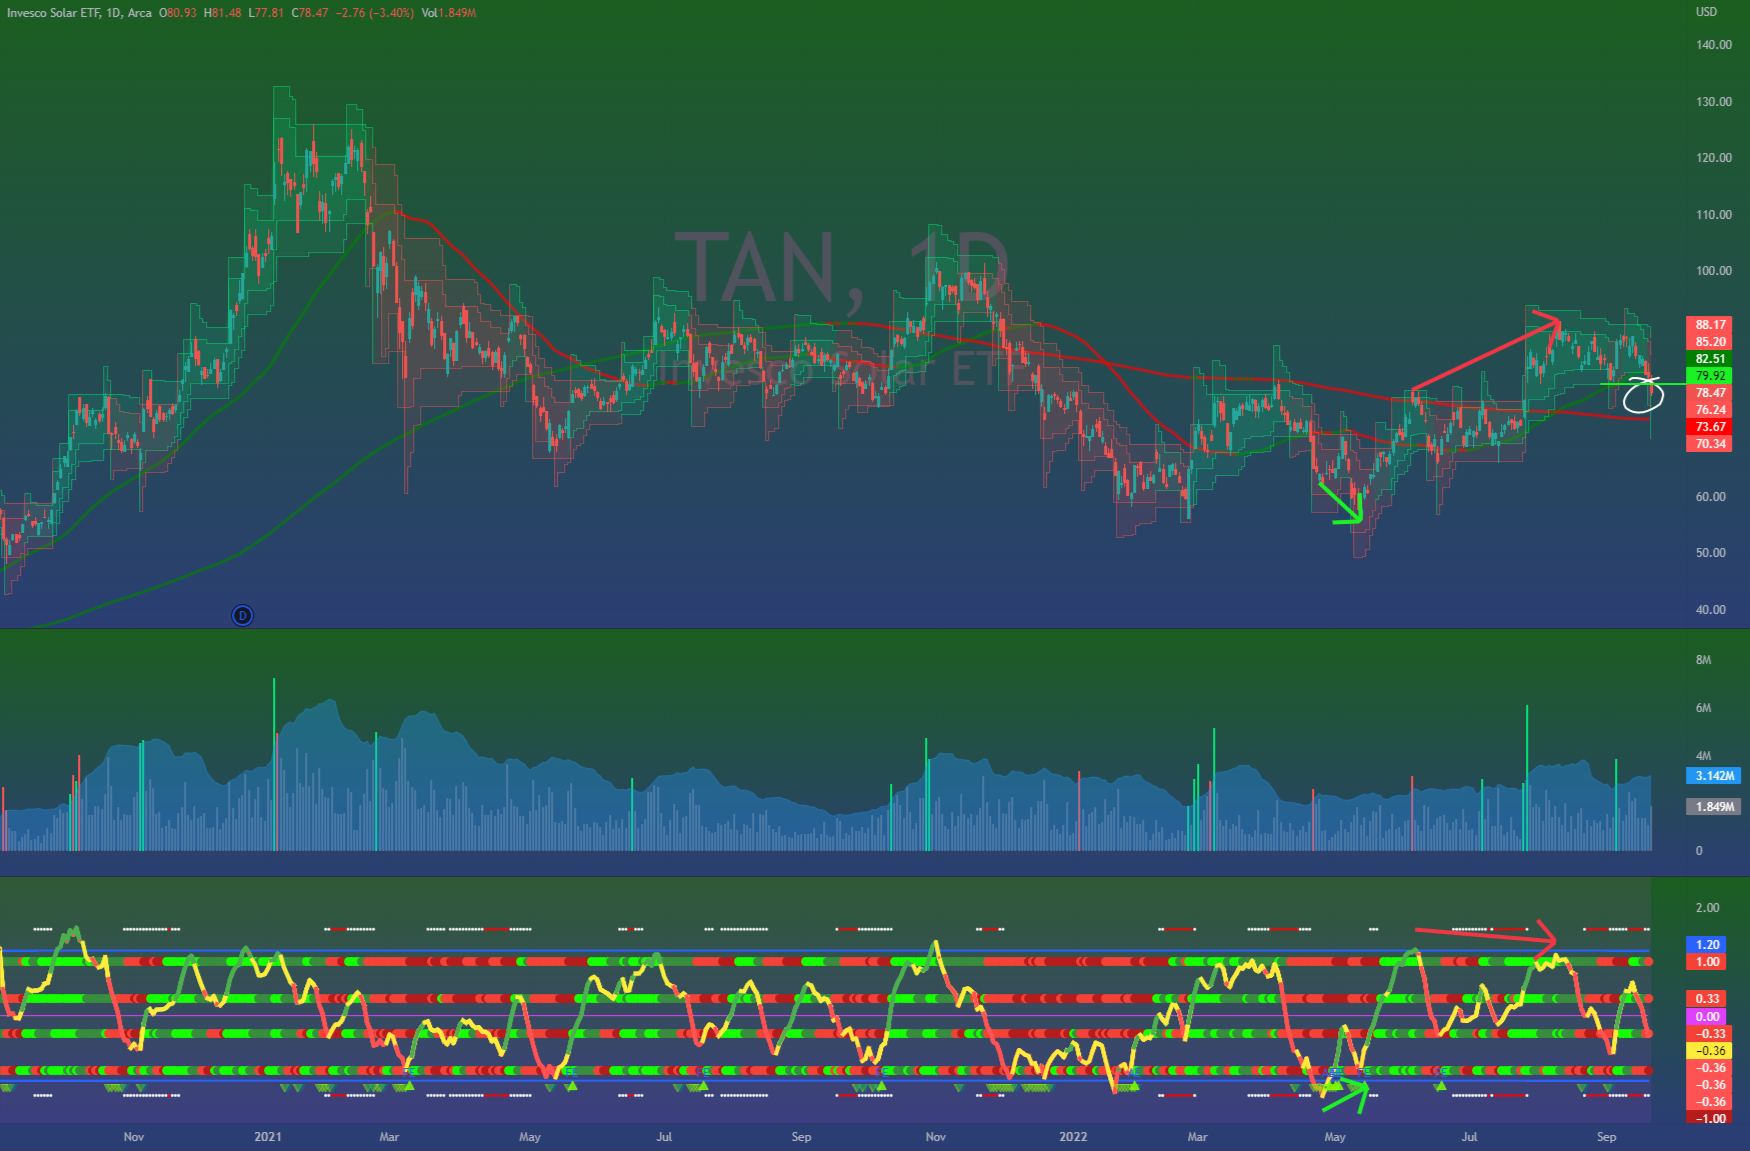
We’re on the daily chart with a much cleaner look as I’ve removed some indicators and added some “beautification”.
As much as I use them, sometimes it helps to pull a few and look at the bigger picture…
Renewables have been the place to be in recent years, but how do you handle when there’s a market-wide selloff?
Oof.
The chart goes back to the massive push higher to the market top…
Since then — if we’re thinking long term — the ETF has chopped sideways.
It certainly won’t feel that way if you’re up close, but that’s why time frames are paramount to managing your expectations…
Using Chris Hood’s TRADECOMMAND tools, the share price is enveloped in channels based on ATR (Average True Range) which turn red on the downswings and green on the upswings.
These are great for managing risk while trading the trend… But as of two days ago, these channels flipped red after breaking below the ~$80.00 level.
Now, I’ve included the 50sma and 200sma so we can see where the first went from green to red as the Death Cross occurred — where the 50sma crosses down below the 200sma.
Both turn red when the price is below the two and they’re moving bearishly…
To keep it simple, what I’d note is that TAN is still putting in lower lows and isn’t yet holding above the 50sma which is why the 200sma is showing red.
There have been a number of divergences here which, if you read my last message to you explaining what you need to know, has made the chop tradeable.
And sure, there are lower lows, but we recently put in a higher-ish high.
But with the break below a key level and under the 50sma?
I’m bearish for now and will watch for a retest of the 200sma near ~$75.00…
That needs to hold.
Keep moving,
(Disclosure: I have no position in TAN but intend to initiate a position in the next 30 days.)

This material is not an offering, recommendation, or a solicitation of an offer to buy or sell the securities mentioned or discussed, and is to be used for informational purposes only. Any performance results discussed herein represent past performance, not a guarantee of future performance, and are not indicative of any specific investment. Due to the timing of information presented, investment performance may be adjusted after the publication of this report. There can be no assurance that the future performance of any specific investment, investment strategy, or product made reference to directly or indirectly in this communication will be profitable, equal any corresponding indicated historical performance levels or be suitable for your portfolio.


