
9/20/2022
With the market attempting to find its footing and school back in session, I figured it was a good time to go over a strategy that’s worked well.
Look, I know that we all just want quick and easy trades and we’re all too old to be in school…
But it doesn’t hurt to sit back and review old lessons every once in a while, particularly when they work.

In fact, it was only yesterday that I took a 29.5% gain on TSLA after one hit the chart using Chris Hood’s custom tools…
Here’s the thing- divergences work on all time frames.
Let’s look at the chart on Momentus, Inc. (MNTS):
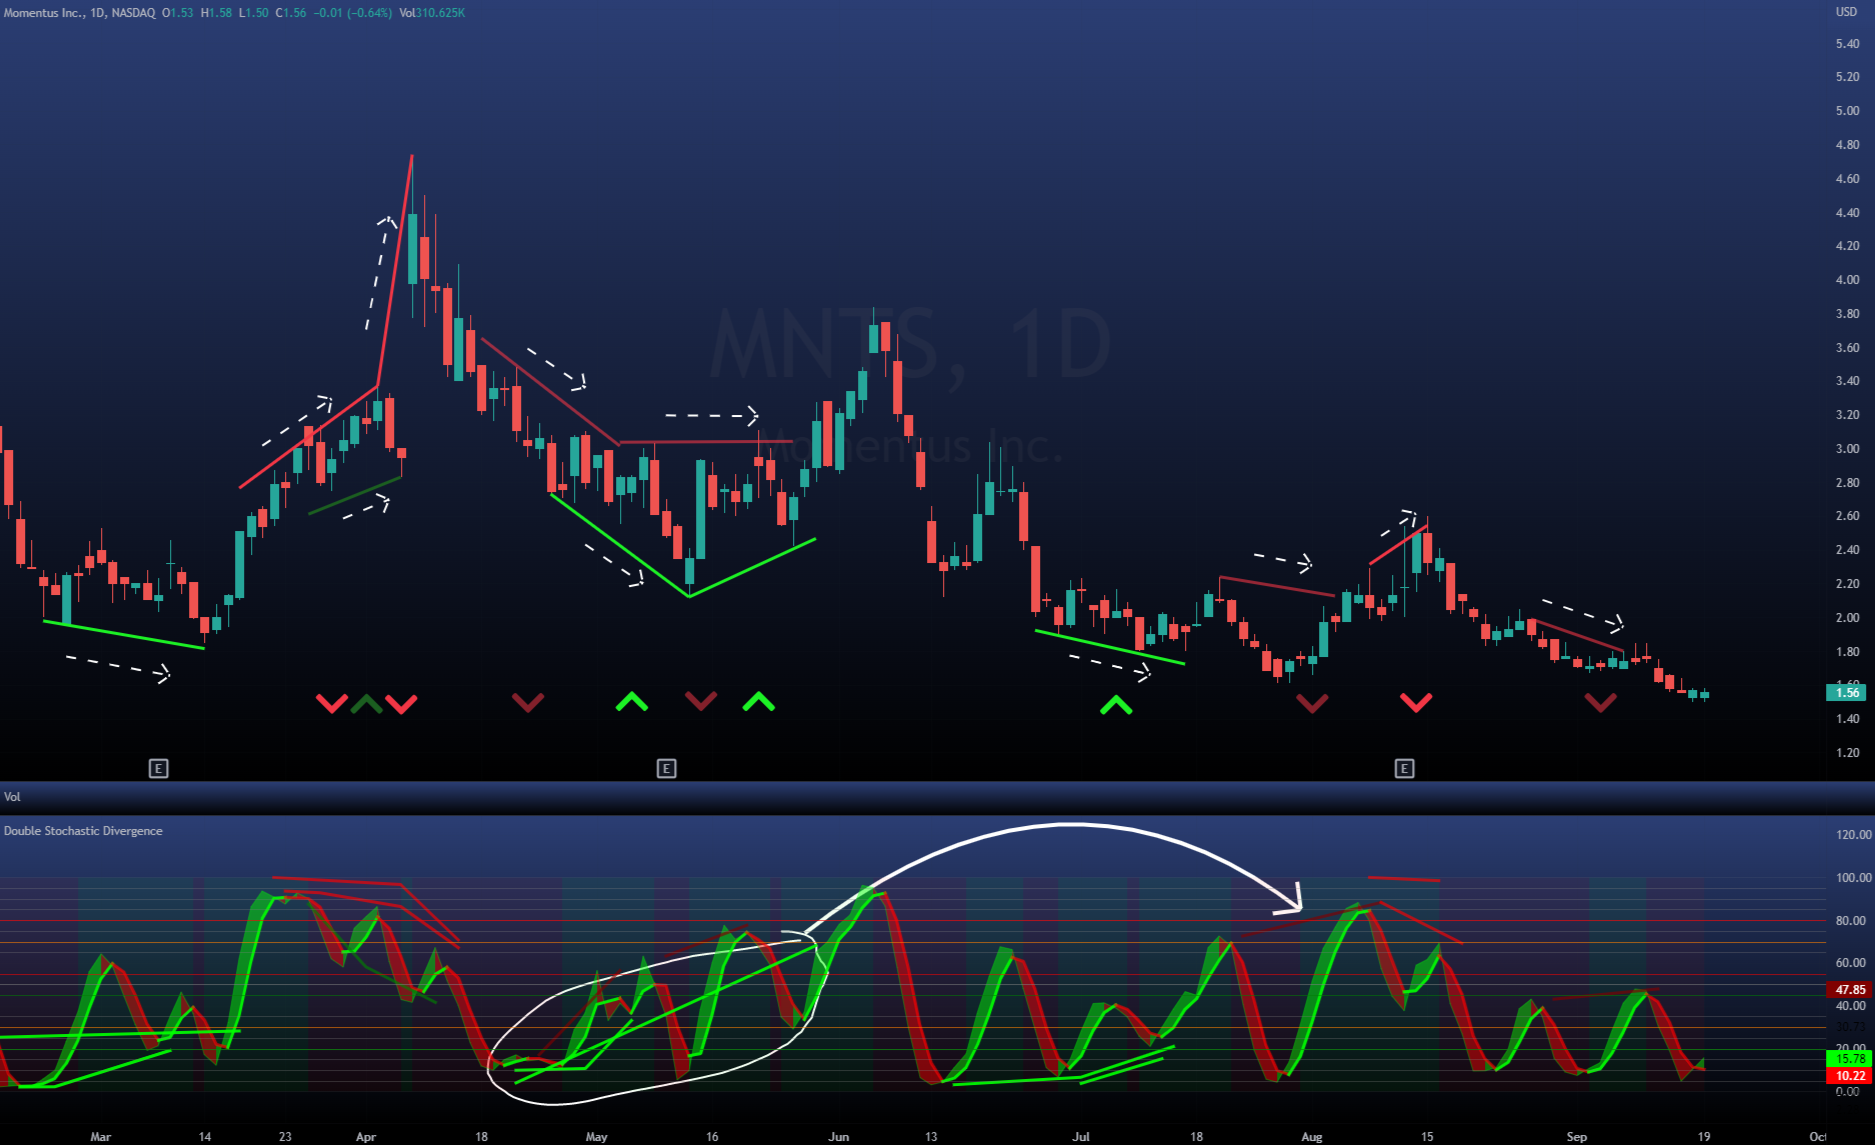
With this being a “lesson” of sorts, I pulled up a Stochastic indicator with divergences built in.
Now, the one thing I want to emphasize is that taking your signals solely from one indicator is an abomination…
The idea is to use multiple indicators, patterns, and setups to find confluence.
But today, we’ll key in on the four types of divergences because they’re not nearly as fancy as everyone makes them out to be.
A divergence is just what you think it is — the price is headed in one direction while the indicator is headed in the opposite.
But there are a couple of rules of thumb:
- Rule 1: Bearish Divergences are based on the highs.
- Rule 2: Bullish Divergences are based on the lows.
When the share price is marching upwards with higher highs, but an oscillating indicator (RSI, Stochastics, etc.) is printing lower highs, the outlook is bearish.
Looking at the chart on MNTS, all bright red trendlines coincide with those on the lower chart where the Double Stochastic Divergence is located…
Higher highs in price, yet lower highs on the indicator. The first set shows the steep drop after the gap-up…
Of course, the opposite is true for bullish moves to the upside.
Notice the bright green trendlines? Now look at the price action that follows…
Lower lows in price, but higher lows on the Stochastic oscillator. All before a subsequent rise in the stock…
Simple, right?
Well, you can get cute with this idea by looking for hidden divergences…
It’s the same idea, but the opposite.
“What?!”
Alright, look- you’re still focused on the highs for Bearish Divergences and the lows for Bullish Divergences. The difference is that you flip the direction of the trendlines on the share price and oscillating indicator.
For example, a traditional Bullish Divergence would have lower lows in price and higher lows on the oscillator.
But the Hidden Bullish Divergence will have higher lows in price and lower lows on the oscillator.
You’re still focused on the highs and lows for bearish and bullish divergences, respectively, but the directions change.
To illustrate, we can go back to the chart…
Look at the dark red trendlines on the upper chart and compare them to the corresponding dark red trendlines on the Stochastic.
This Hidden Bearish Divergence shows lower highs in price and higher highs on the oscillator…
That said, I wouldn’t put but so much emphasis on the hidden divergences as they only tend to play out when the divergence is strong.
I’ve circled an example of where a Hidden Bearish Divergence fails as the Bullish Divergence is primary and then an arrow pointing to where it follows through…
Let’s review:
- Price: Higher Highs + Oscillator: Lower Highs = Bearish Divergence
- Price: Lower Lows + Oscillator: Higher Lows = Bullish Divergence
- Price: Higher Lows + Oscillator: Lower Lows = Hidden Bullish Divergence
- Price: Lower Highs + Oscillator: Higher Highs = Hidden Bearish Divergence
Lastly, remember, bearish divergences are identified using the highs and bullish divergences are seen on the lows.
As for the hidden divergences, they’re secondary…
Now, go find some and take profits!
Keep moving,
This material is not an offering, recommendation, or a solicitation of an offer to buy or sell the securities mentioned or discussed, and is to be used for informational purposes only. Any performance results discussed herein represent past performance, not a guarantee of future performance, and are not indicative of any specific investment. Due to the timing of information presented, investment performance may be adjusted after the publication of this report. There can be no assurance that the future performance of any specific investment, investment strategy, or product made reference to directly or indirectly in this communication will be profitable, equal any corresponding indicated historical performance levels or be suitable for your portfolio.


