

Date: 4/27/2021
Author: Chris Hood
Be sure to check out new episodes of my video podcast each week, where my ace pupil Brian Jones and I talk the ins and outs of options trading- and give you insights and strategy that you can immediately put to work for you in the markets.
Bull markets and uptrending stocks don’t move in a straight line.
Anyone who looks at a chart can clearly see this.
They go climb for a bit, dip to some level of support and then take the next leg up the ladder.
Consider your own psychology for a minute, and it’s clear why this happens.
When you’re bullish on a stock and place a long trade – whether buying shares, long calls, or bull call debit spreads – you want to buy something cheap and sell it for a profit.
So does everyone else.
This includes retail traders with billions of dollars and institutions.
After a solid run-up, people want to take some profits off the table. When those people sell hundreds of thousands of shares, the ticker moves down.
It’s a pullback. A healthy part of any continuing uptrend.
Short-term swing traders may only try to catch a bit of each minor upswing. If that’s your style it’s perfectly fine.
Get in on the run up and out before the dip.
In contrast, long-term positional traders try to capitalize on major upswings that could involve weathering the storm on a few pullbacks. They take advantage of these as opportunities to buy more shares or contracts.
Bright red on the screen has a way of touching off fear in our monkey brains.
For novice retail traders, dips can be difficult to handle. They get scared, dump winning trades, and miss out on the big wins.
Unlike stocks, option P/Ls can fluctuate wildly in your portfolio.
They aren’t just affected by the stock price but by volatility and demand. A winning options position might be at -60%, then swing back to profits the next day, or even within a few minutes.
One way of dealing with this is to just turn off your P/L.
I recommend this to my clients all the time if their emotions are getting the better of them.
Focus on finding the proper setup, then give the trade time to work.
If your trading plan is based on percentages, then put your profit taking autoclose order when you place the trade.
For traders using the stock price as an exit, just create a profit-taking alert and forget about it.
Only exit the trade when the trend breaks. Your plan will let you know when this happens.
There are numerous technical indicators to identify a broken trend. You just need to decide which to use based on your strategy.
Common indicators include exponential moving averages based on different periods – 8EMA, 11EMA, 21EMA, or 34EMA
If you are holding extremely long-dated options to ride long trends, then your exit criteria should reflect his.
Never manage a long-term trend on a short-duration signal.
Let’s look at a ticker my clients and I are currently trading and identify these pullbacks, ITB.
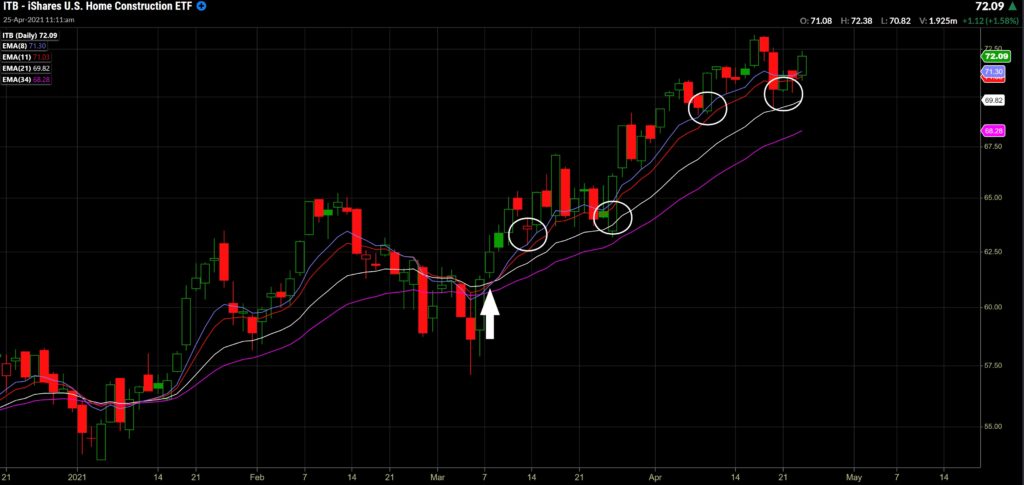
Suppose you entered at the arrow on March 8th with a long call or bull call debit spread and intended to hold this trade for a few weeks or more to capture as much upside as possible.
You decide that a daily close below the 34EMA is your signal to get out.
On this chart, the 34EMA is plotted as the white line.
As the stock rose, you would have seen some wild swings in your P/L on March 14th (first circle) as the ITB dipped after a weeklong run.
Rather than going crazy and selling, you noted that it did not close below your exit trigger. Ignoring the red, you simply added another few calls or call spreads.
Just as you expected.
ITB moved up a bit then pulled back again.
This time you’d have been feeling the heat as several days of consolidation and negative price action sent your P/L wildly into the red.
But you stuck to your plan.
No close below the 34EMA, so you stayed in. But not only did you stick with your trade, but you also added a few more positions.
Depending on your profit targets, you already taken some money off the table. However, considering the trend stayed intact, you decided to keep the newer positions on.
With each pullback, you bought more and were rewarded.
Hope you bought some more last week as this looks like one hell of a moneymaker.
Look where ITB sits in its Keltner channels in the graph below.
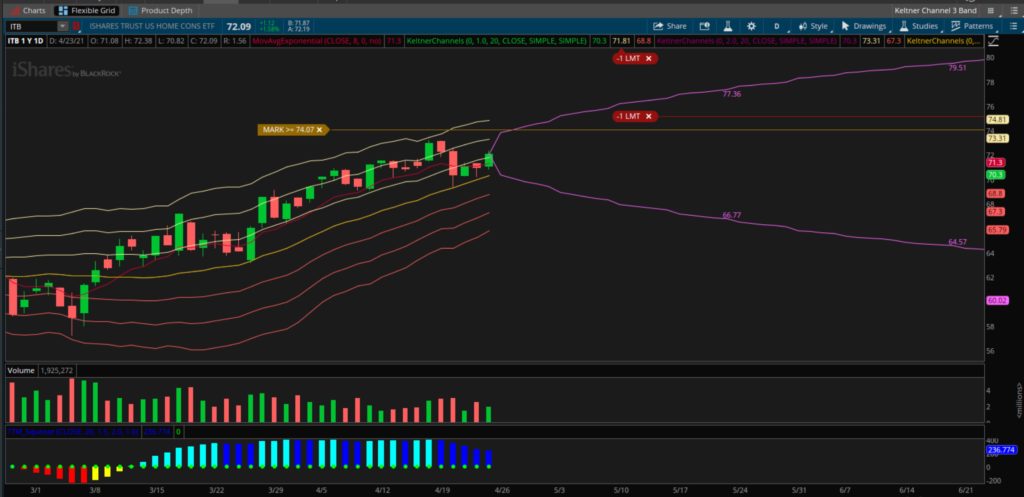
When stocks are sitting above the middle line (green) and the third or top line, there’s a high probability of continued movement upwards.
Looks like more upside and more profits are on the horizon.
The take-home point is this:
Before you enter, know how long you’re going to ride the trend, then manage your additions and profit-taking accordingly.
Next time we’ll discuss risk how to play with house money and trade risk free.