

Date: 8/12/2022
Author: Chris Hood
It seems like everyone is excited.
The market has had a nice run through some key resistance levels on the daily chart.
Green days and higher prices for SPY. The crowd is screaming, “BUY NOW!”
And this always makes me a bit nervous.
I have my tools and my charts. I don’t follow analysts’ advice or make trades based on hunches. As much as I’d like to see an economic recovery, I always follow my indicators.
In my world, trends aren’t defined by opinion.
Instead, I utilize a proprietary mix of indicators that establish a “volatility band” around a ticker’s price action.
Obviously, I’m not going to tell you the exact mix of data in my code, but I can explain the basics.
My tool’s volatility band establishes a range of what could be considered normal price movements over a given time frame.
Let’s look at how it works and why I’m not yet convinced there isn’t any more downside.
Look at the daily chart of SPY below.
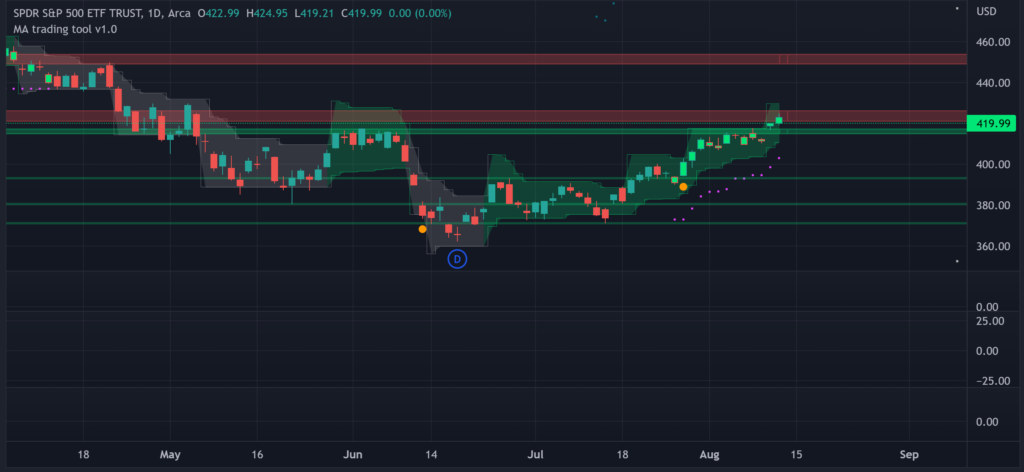
Notice how the candles are surrounded by a green or grey band. Backtesting and accumulated data from my own real-money positions tell me this. As long as the band is grey, there is a much higher probability of downside than upside.
On the daily chart, green means go.
I’ve been trading bullishly for the short term and doing well.
But we can’t ignore the longer time frames when we want to be sure that a trend has reversed.
Now take a look at the weekly SPY chart. Unfortunately, though we’re headed in the correct direction, the band’s color has yet to turn green.
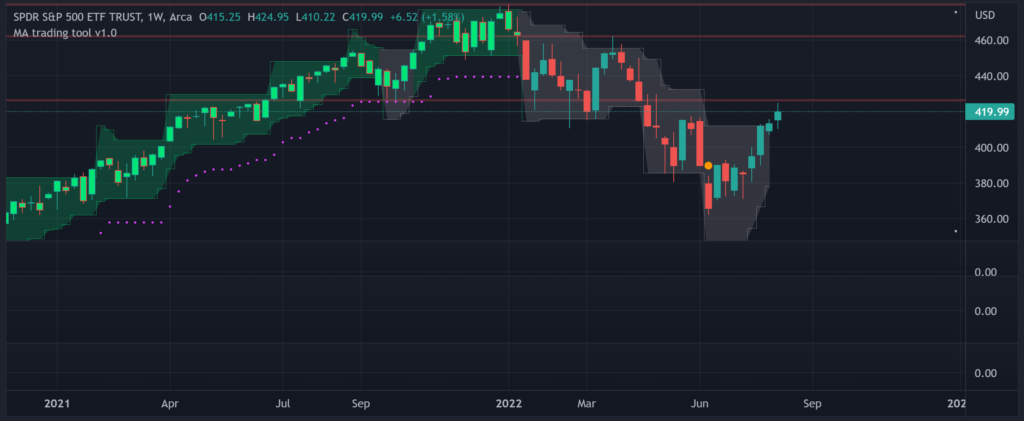
So as far as I’m concerned, the weekly trend is still down, and down markets can last a while.
Not to bring too many fundamentals or speculation, but the economy is in some strange times. It will take more than just a few positive unemployment data or a single “indecisive” CPI report to make me believe everything is ok.
Finally, let’s consider the monthly chart.
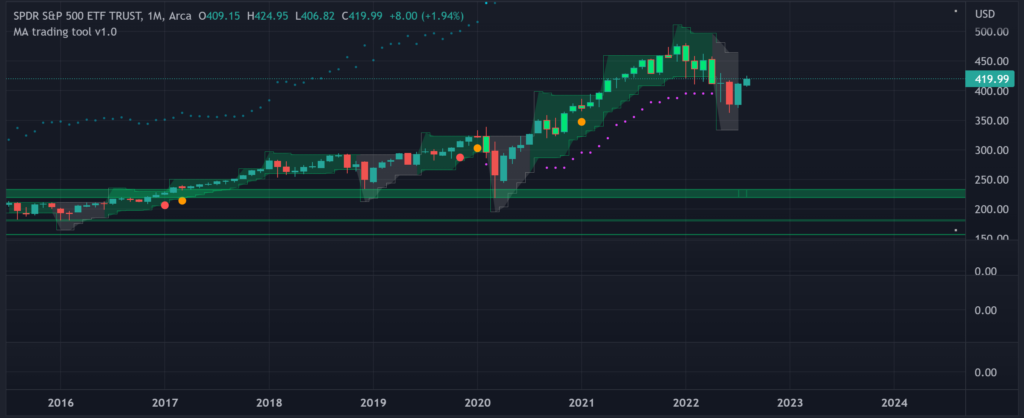
The monthly price is still firmly within a bearish grey band.
All this means is that even the multi-day rally we’ve had might be just a little pop-up on the way down.
It could also be the start of a reversal.
The key here is that it doesn’t matter. These bands are one of several powerful tools that guide my trades.
Of course, I’d love to see the economy recover, but the market direction is irrelevant from the perspective of profitable trading. If I’m positioned on the right side of the trend (as defined by the volatility bands), my odds of winning are high.
Being profitable as a trader means ignoring the crowd’s chants and trusting your system. Don’t get suckered into opening positions based on what others say.
Be confident in your own analysis.
Cheers,
Chris Hood


