

Date: 9/2/2022
Author: Chris Hood
It’s been a fast downhill slide after that brief rally on SPY.
And I’m sure many people got caught holding bullish positions at the top. If so, it’s likely been a painful ride down.
I recall my earlier price forecast that SPY would hit 380 in August.
I was obviously wrong about that and made the necessary adjustments to my market forecast. Knowing where the market is headed is one thing, but timing those price targets can be difficult.
Keep this in mind as you read on.
My key signals all show a bearish outlook on SPY over the next couple of weeks.
Likewise, QQQ, an ETF that tracks 100 of the largest NASDAQ companies, is also looking weak. It’s worth noting that QQQ is extremely heavy in technology stocks.
…and technology stocks prop up the market.
Like most traders, the one question you’re probably asking yourself is this.
Just how low is the market going to go?
It’s impossible to tell. But the tools I’ve developed – the ones that keep me profitable – suggest quite a bit more downside.

If you’re a seasoned options trader, it doesn’t really matter the direction…puts are as easy to buy as calls.
However, if you’re a die-hard bull. Or just aren’t as practiced with bearish positions, then be careful.
Unless you are trading on intraday time frames, be very careful with any bullish positions on SPY, QQQ, or high beta stocks.
Just as a reminder – beta is a measure of how correlated a stock is with the broad market. When the market drops, these tend to follow.
Before we take a look at the chart for SPY, I’d just like to say that these include lots of indicators.
Some people say too many.
But they work for me, so I’m okay with it.
In fact, as you look at these, notice just how accurate the short and long signals have been. These are just some of the tools I’m making available very soon.
So here’s the daily chart on SPY.
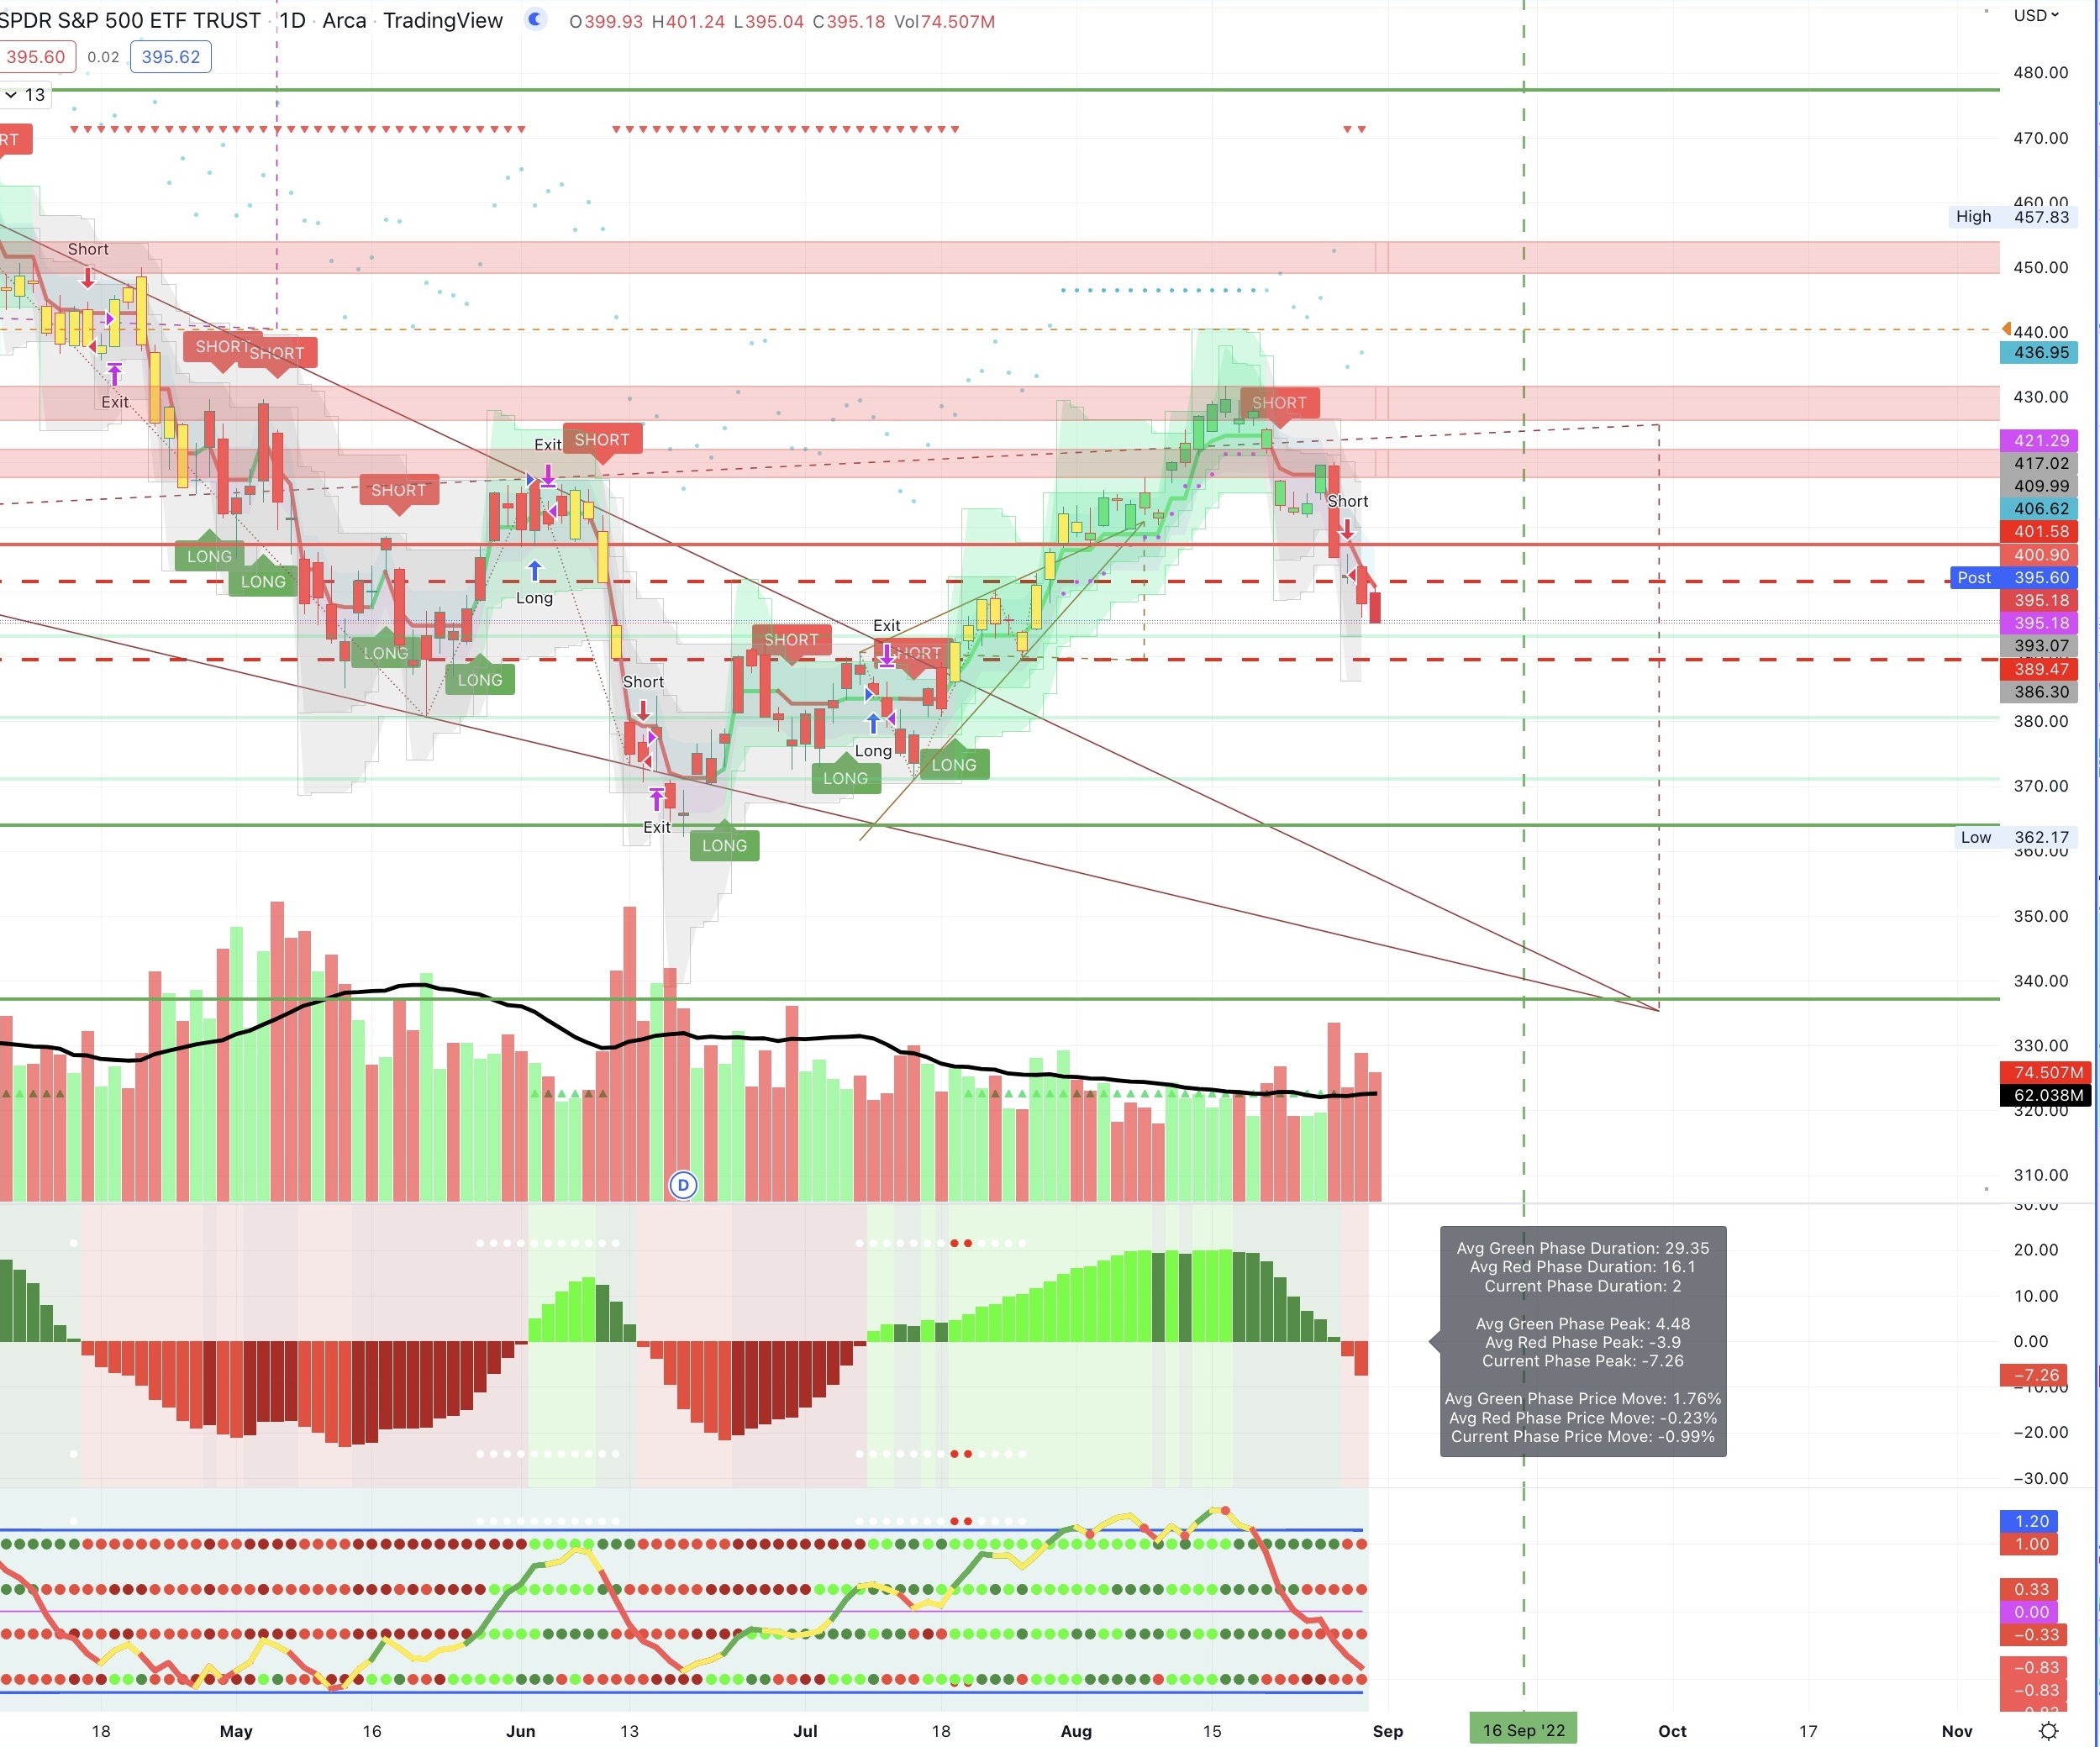
I won’t go into the specifics of all these indicators, but it’s telling me now that there could be two more weeks of downward momentum.
Where does this put us?
Follow the two red lines that form a point at the 335-340 level.
My analysis is telling me we might very well hit that this month.
If we look at the daily chart of QQQ, there’s a similar story.
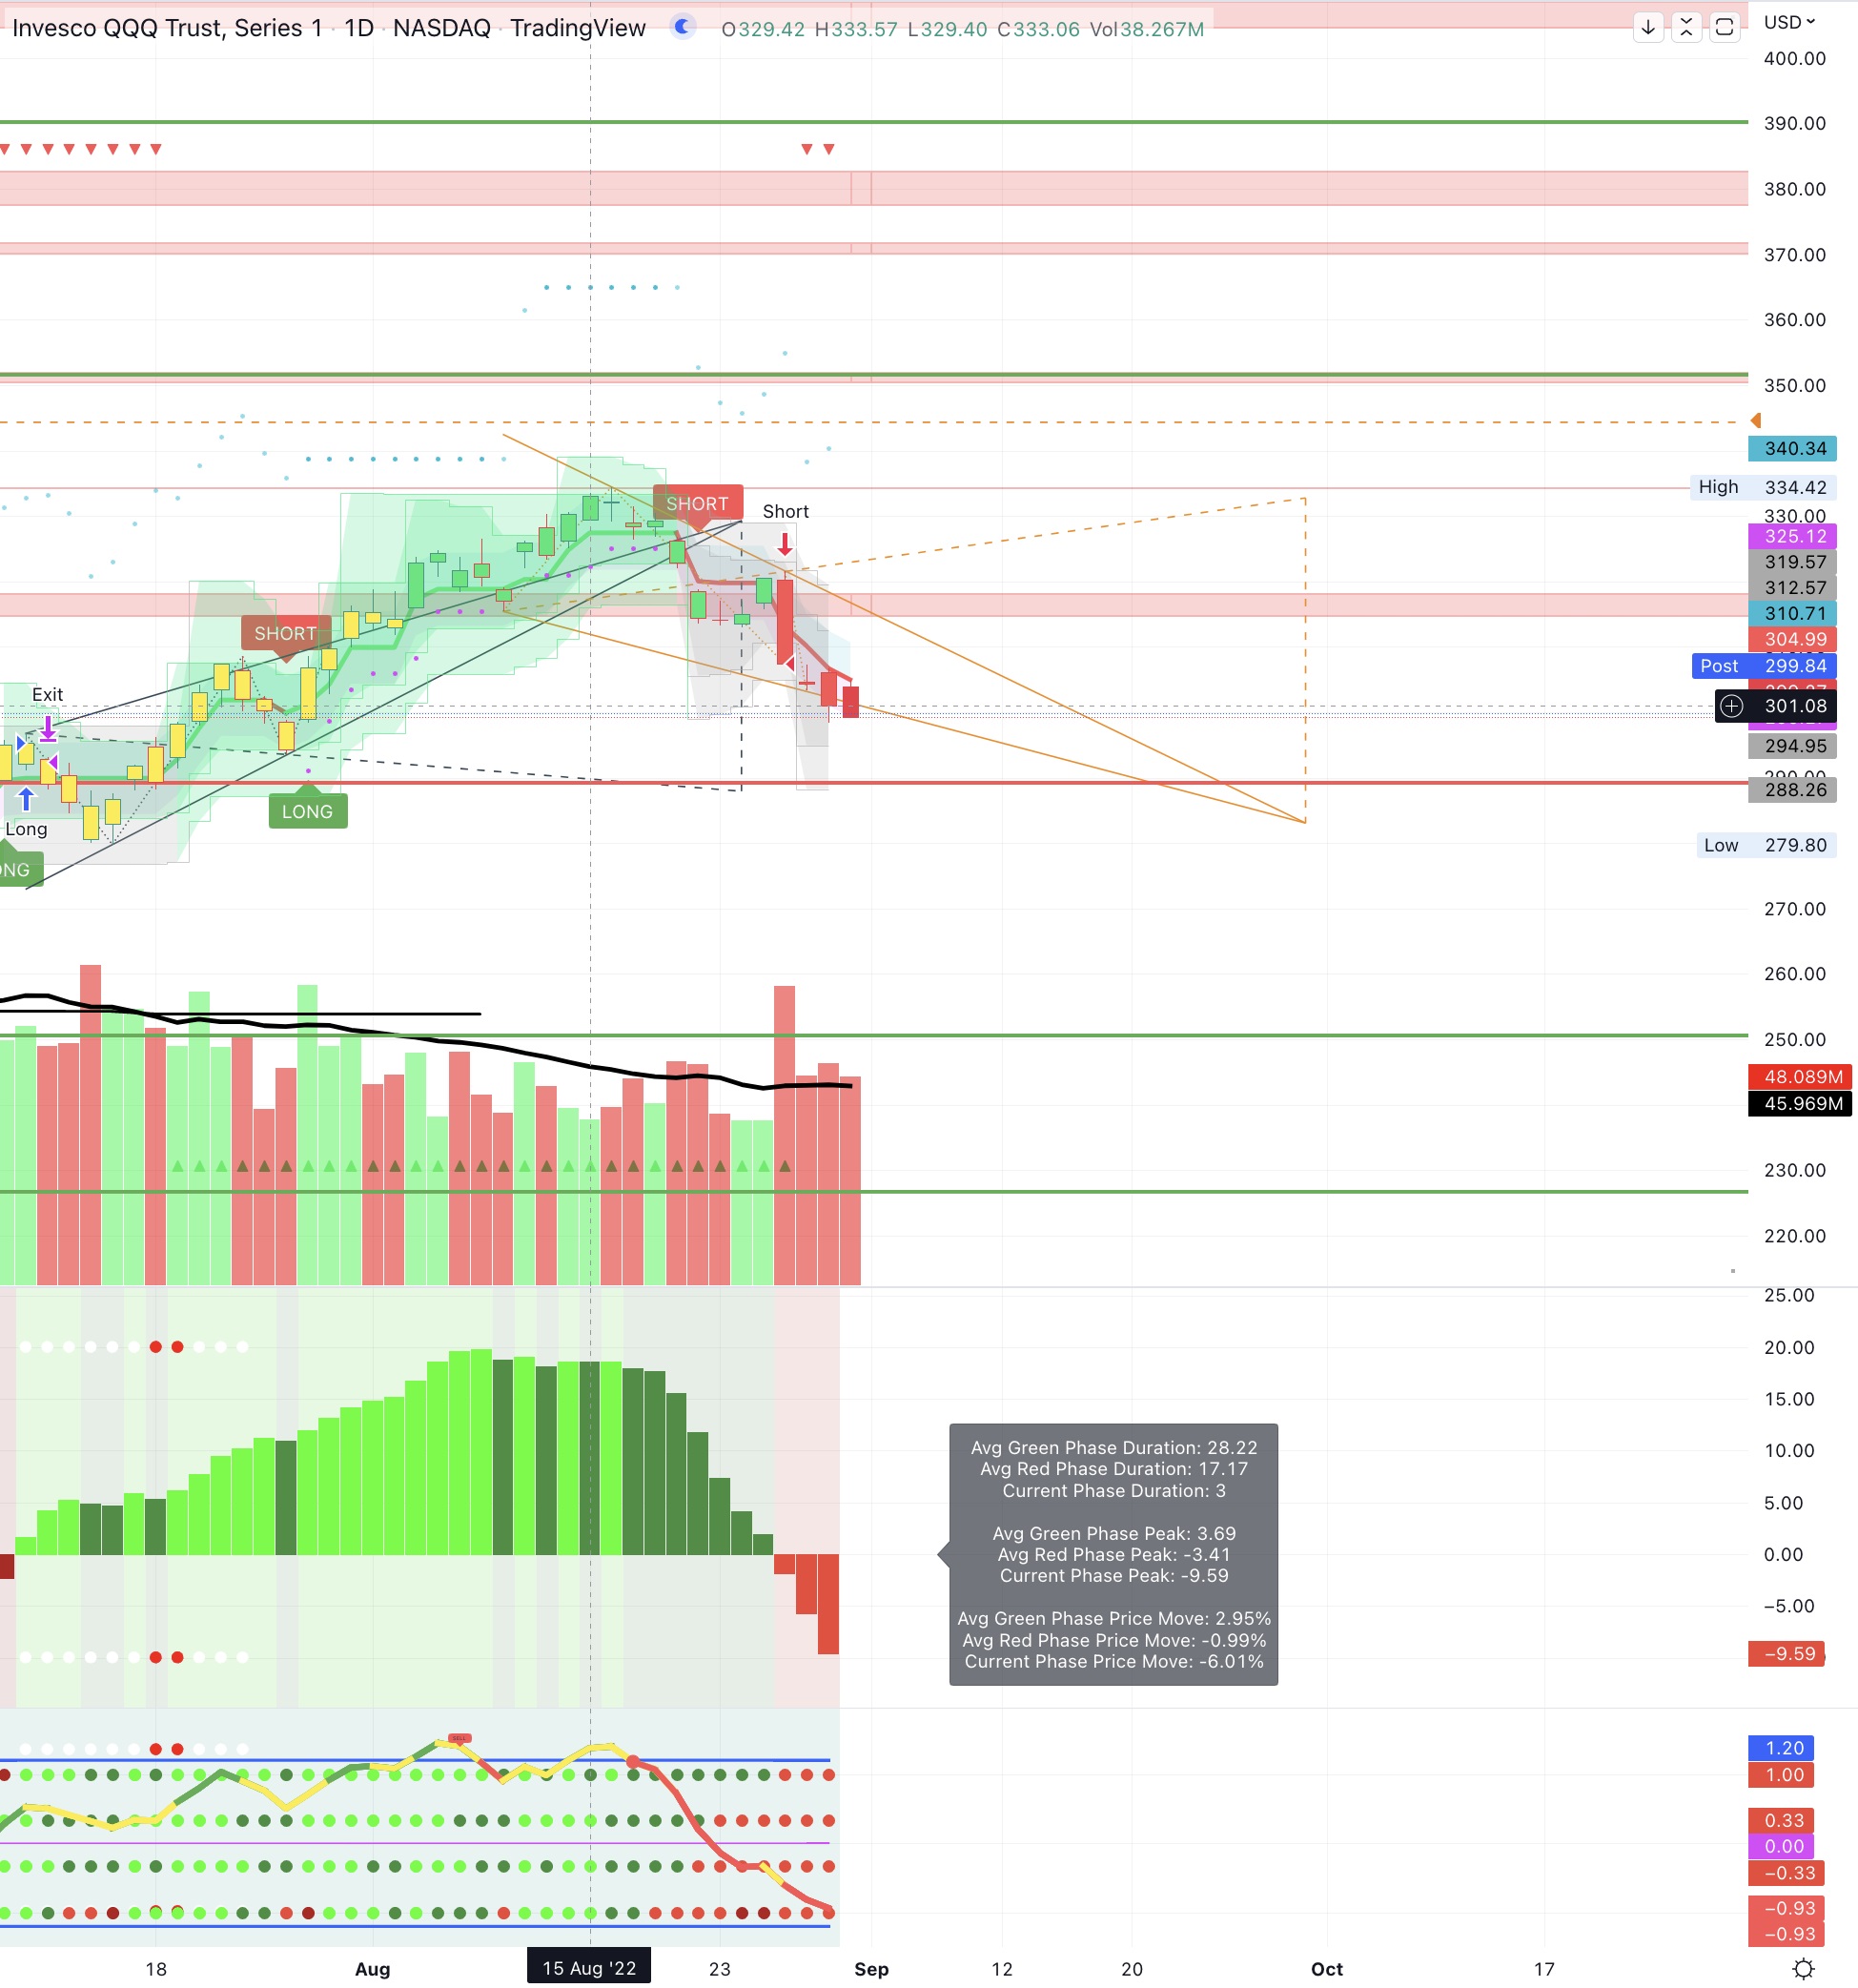
It’s in a serious downtrend with a price forecast of around 280.00.
This is way more analysis than I usually give in an editorial. Still, I don’t want you to lose everything going all in on a dead cat bounce like we just had.
My subscribers get information like this daily, and I show them how to perform these analyses themselves.
But even if you’re a casual reader, I appreciate you and want to keep you safe.
Honestly, no matter who you are, I wish you success.
Keep in mind that no prediction is 100% correct.
Everything on this chart could change over the weekend. However, my system backtesting and real-time win rates suggest I have probability on my side.
As always, your trades are your decision. Just stay safe out there.
Cheers,
Chris Hood