
2/8/2023
Dear Trader,
Oh, but they do exist…

But where’s the share price going before the next payout?
This is General Dynamics Corporation (GD):
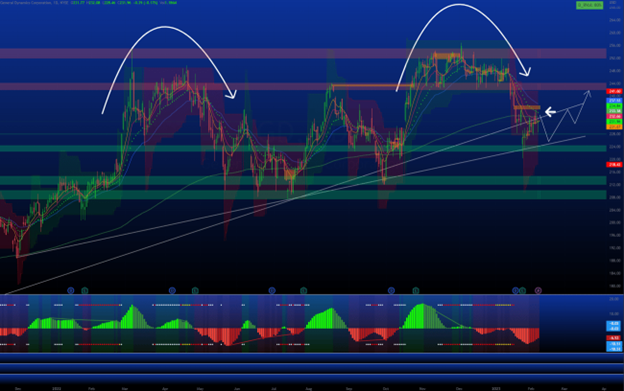
These are the green and red horizontal channels you see, respectively.
Call it supply and demand, buyers and sellers, whatever…
All that matters is that we pay attention to where the share price is deemed valuable and overpriced.
Here, Support rests at the ~$225.00 mark with Resistance clearly sitting above $245.00.
And overhead is pressure close to ~$250.00.
Remember, nice round figures are psychological and algorithms are programmed to mimic human behavior…
Looking at moving averages, I’ve dropped a white arrow at the 21ema (green dotted line) which is known as a “mean-reversion” indicator.
Why?
Breaks above are seen as bullish. Below, bearish.
And right now, GD is below, although it’s teasing that it wants to move higher with the rest of the market.
The long white trend lines are extended from previous bounces and you can see that the share price is stuck between them.
The stock would need to stay above both and break over the 21ema to begin the bullish move higher, but I’d anticipate one more retest of the mid-$220’s.
What sticks out here are the rounded turns downward (curved lines).
Maybe a bit nuanced, but when a stock continues round downward, it’s a sign of weakness…
Watch for that Support level to hold…
If it fails, you’re risking less.

This material is not an offering, recommendation, or a solicitation of an offer to buy or sell the securities mentioned or discussed, and is to be used for informational purposes only. Any performance results discussed herein represent past performance, not a guarantee of future performance, and are not indicative of any specific investment. Due to the timing of information presented, investment performance may be adjusted after the publication of this report. There can be no assurance that the future performance of any specific investment, investment strategy, or product made reference to directly or indirectly in this communication will be profitable, equal any corresponding indicated historical performance levels or be suitable for your portfolio.


