
07/28/2022
Social media and chatrooms have changed the way a lot of stocks move… crypto too.
Briefly, let’s talk about how “pumps” work…
A faceless “furu” (financial guru) with tens of thousands of followers on Twitter tells his private chatroom of a couple of hundred users that everyone needs to buy ABC stock.
15 minutes later — after all his buddies are in — he posts a chart on Twitter…
…and then the stock goes parabolic.

It’s not a tactic that I agree with… But if it’s running and I like the setup, sure, I’ll hop in.
Let’s chart the most recent pump because it just might have some more legs to it…
This is ToughBuilt Industries, Inc. (TBLT):
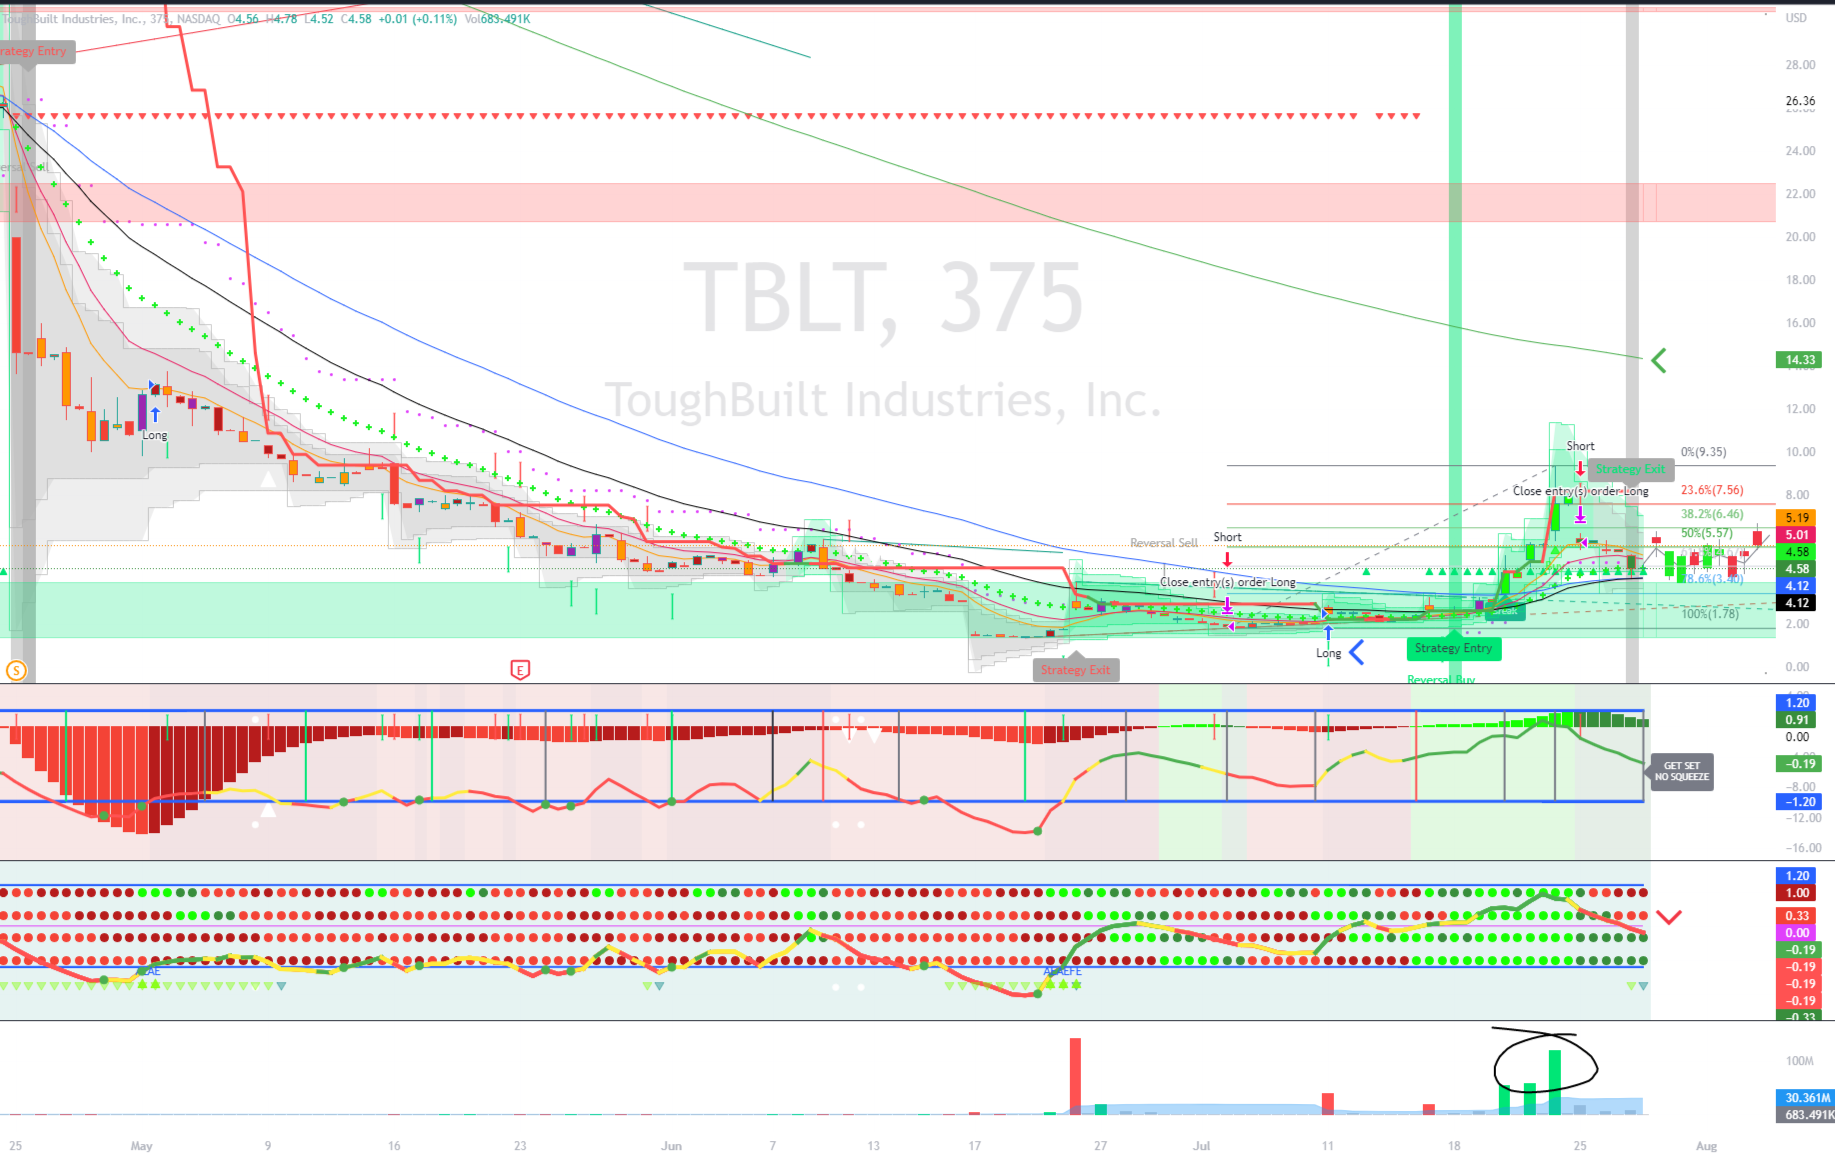
Above is the 375-minute chart.
The reason we’re looking at this is because getting too close can blind you to the bigger picture if it dumps.
Knowing the levels to watch is a must in this market…
Typically, the Support and Resistance channels are more obvious, but with a zoomed out time frame, you can see that the stock has no real Resistance until around ~$20.00 or so…
That’s a hell of a lot of open space.
The question traders have to ask themselves is this: What is my time horizon?
The answer to that will tell you if it’s worth holding and l think the 200ema (green arrow) could be a solid target area, eventually… But let’s not get ahead of ourselves.
Now, without the channels, you have to look for gaps and use Fibonacci Retracement and eye the 78.6% level considering the magnitude of the bullish run.
Notice the Short signal occurred right at the gap down from ~$7.56, so we know this will likely get filled, potentially in the near future off of a reaction low.
Based off of pattern trading, I’d expect the price to fall again towards the lone Support channel.
Expect volatility…
On The Squeeze Trading Tool 1.2A there’s nothing to be bullish about after the previous multi-triple-digit run and the Squeeze 4-Pack v8 is giving a mixture of red and dark green dots with the Stochastic line red and pointing downward.
After a jump like this, you have to trade the shorter time frames, but know this: Your risk will be elevated.
For now, I like it for day trading, but for the bigger move I’d look for the pace to slow down until you see spikes of Volume like the ones preceding the current run.
No FOMO, folks. Patience.
But keep this on your watchlist because stocks will move when you least expect it…
Keep moving,
(Disclosure: I hold no position in TBLT but intend to initiate a position in the next 30 days.)

This material is not an offering, recommendation, or a solicitation of an offer to buy or sell the securities mentioned or discussed, and is to be used for informational purposes only. Any performance results discussed herein represent past performance, not a guarantee of future performance, and are not indicative of any specific investment. Due to the timing of information presented, investment performance may be adjusted after the publication of this report. There can be no assurance that the future performance of any specific investment, investment strategy, or product made reference to directly or indirectly in this communication will be profitable, equal any corresponding indicated historical performance levels or be suitable for your portfolio.


