
01/28/2022
Happy Friday folks!
For today, I thought I’d spice things up a notch and ask for the queen of ETFs’ hand…
That’s right. I’m talking about Cathie Wood.
She’s gotten a bad rap recently and it seems that the financial media and everyone that didn’t capture last year’s run in her flagship fund is overjoyed to see it fall from grace.
After all, it must be easy to manage a fund in this environment…
But we’re only here for the technicals and to trade what we see.
Today’s chart is wild-looking and looks like a disco, so go ahead and dime your speakers to the Bee-Gees.
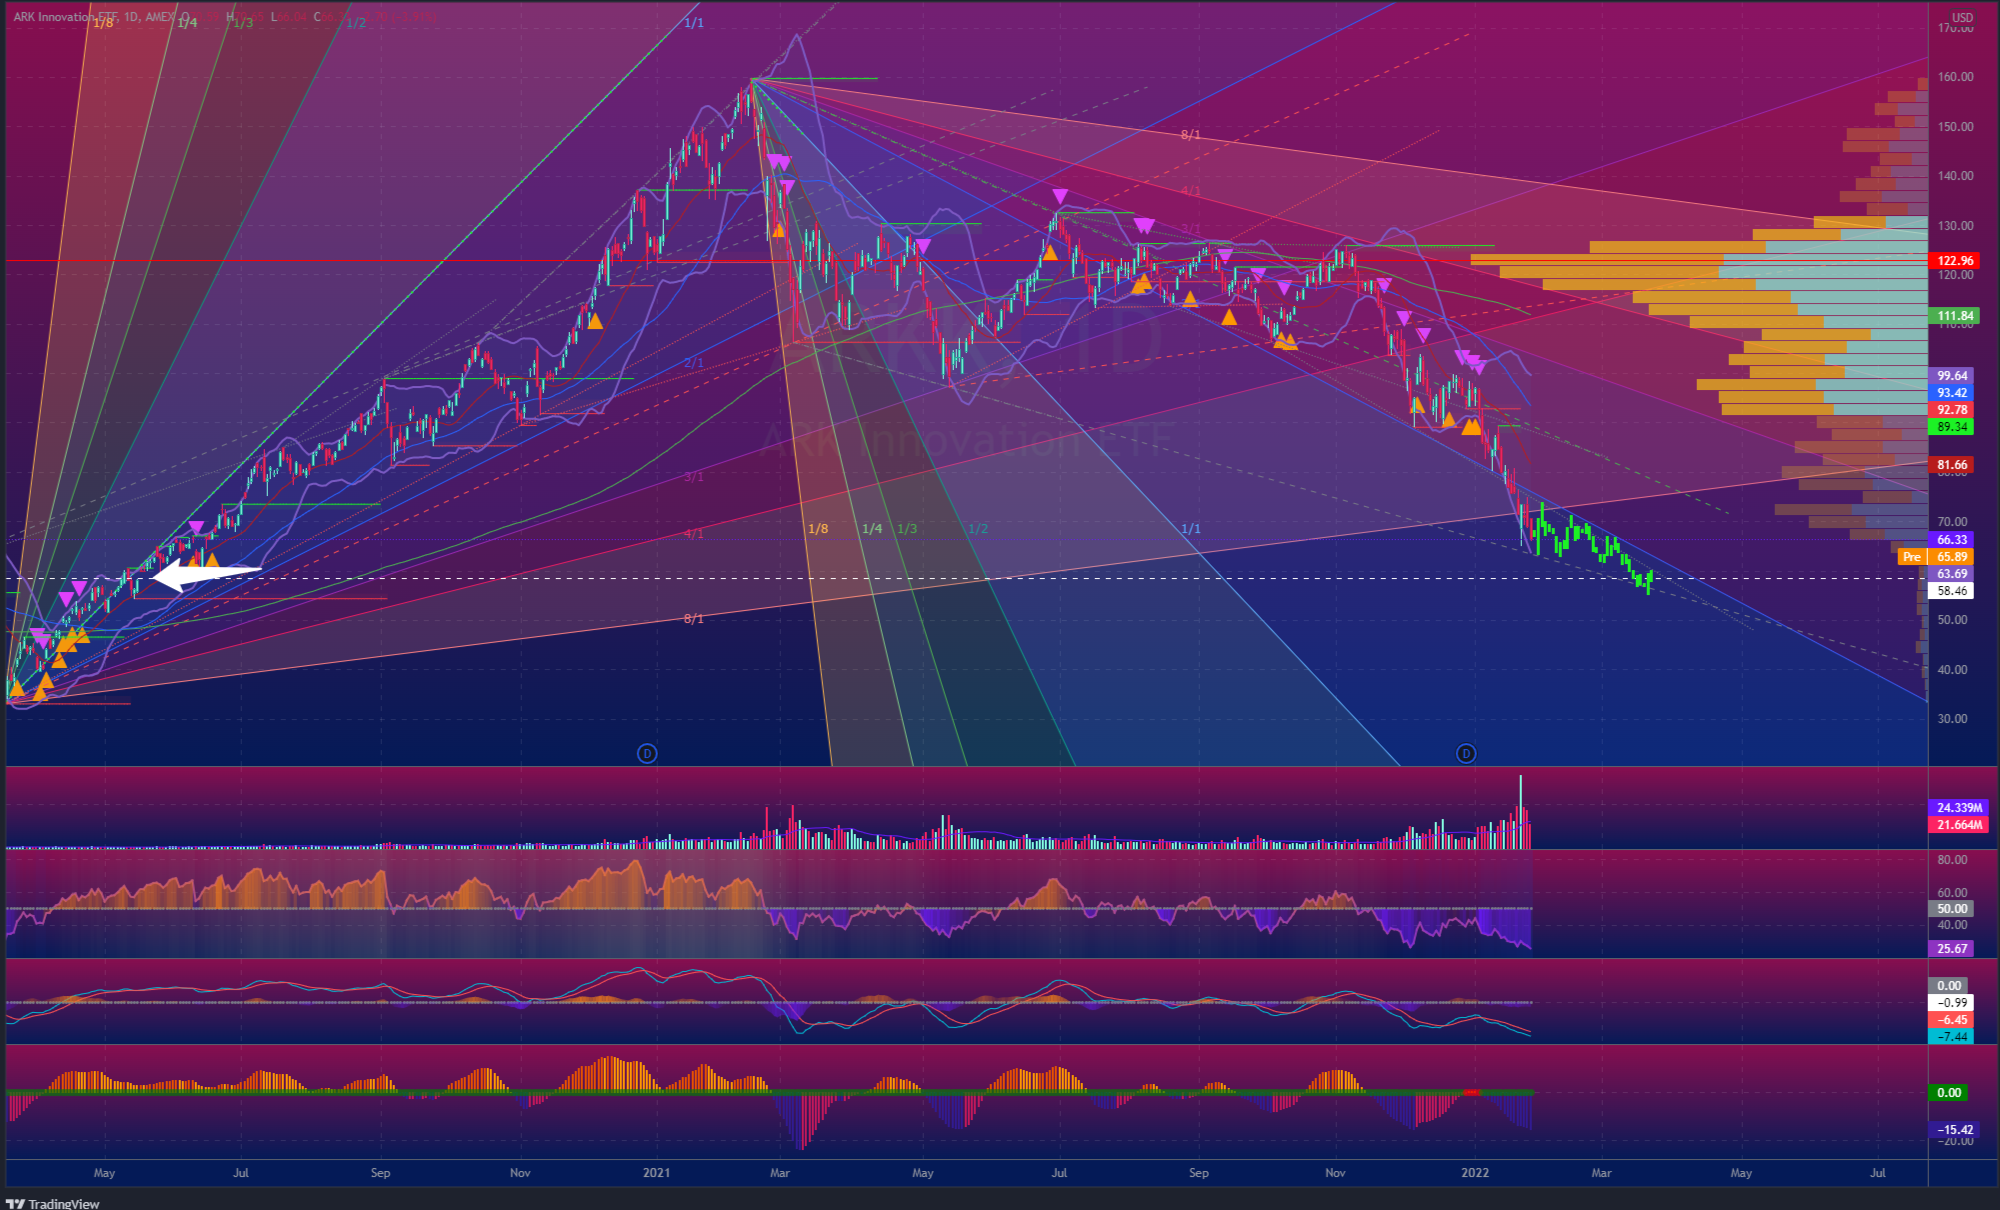
I’ve charted from the bottom of the pandemic fallout up until now on the daily time frame so we can get a look at the full picture.
Let’s face it, no tech-heavy ETF can continue running in perpetuity…
But your time horizon will dictate whether or not you stay in.
“What’s with all the wild colors?”
Those are Gann Fans.
If you’ve ever gotten your hand on any of the old materials on technical analysis, W.D. Gann was an analyst that found the 45-degree angle to be of importance when looking for trend violations and a number of tools based on this idea are still used today.
In this instance, the focus is on the 1/1 line. The reason many traders use Gann tools is because of their reverence for time…
Each subsequent level factors time into the equation, so speed is a central aspect that is vital to investors looking further ahead.
Notice that as each of the fan lines move away from the central 45-degree 1/1 line, they narrow… Moves on these lines typically narrow in terms of range, although this varies.
Now, ARKK found a steady climb along the 2/1 before falling through which could have given us the SELL signal.
I’ve drawn another set from the high and it again found support on the falling 2/1 line, even attempting a breakout above the 3/1…
One problem.
It violated 2/1 line this previous week and began falling at an even faster rate, turning the 2/1 into resistance…
Although I’m using Gann Fans here, it should go without saying that — like all things in analysis — basing your trading on a single indicator or study is the quickest way to lose money.
But take a look at the gray dotted trendline beneath the current candlesticks.
This is the current falling support.
Over to the left, I’ve drawn an arrow pointing out where ARKK could potentially settle and reverse.
Why here? Gap.
Once this fills, a short-term reversal could be in the cards out of a Falling Wedge… But I’d look for more downside shortly after.
Sorry, Cathie.
Keep moving,
(Disclosure: I have no position in ARKK, but intend to initiate a position in the next 30 days.)

This material is not an offering, recommendation, or a solicitation of an offer to buy or sell the securities mentioned or discussed, and is to be used for informational purposes only. Any performance results discussed herein represent past performance, not a guarantee of future performance, and are not indicative of any specific investment. Due to the timing of information presented, investment performance may be adjusted after the publication of this report. There can be no assurance that the future performance of any specific investment, investment strategy, or product made reference to directly or indirectly in this communication will be profitable, equal any corresponding indicated historical performance levels or be suitable for your portfolio.


